I have always been a great fan of ratio analysis. Being a trainer in core finance, I often get an opportunity to discuss ratios with my students and they always sense the passion I embody while discussing the subject. One such ratio which has been doing it’s rounds in my mind is the ‘Market Capitalisation to GDP’. It makes a lot of sense to me as a macro-economic indicator to compare the market values of the companies and the overall GDP of the economy to which those companies are contributing. Later on, when I came to know that it is the favourite indicator of Warren Buffet, I thought it worth to stretch out a little bit to see what makes it so.
I do not want to make this a scholarly treatise on ratio analysis. My endeavour is to keep things as simple as possible, though I don’t wish to over-simplify things.
To put it in straightforward terms, we use the market values of all the listed companies on the NSE/BSE and divide it with the GDP of the economy. GDP, again, can be considered either as trailing four-quarter GDP or as Advance GDP, depending on how smoothened-out data you want.
If Market Capitalisation > GDP [ meaning the ratio is above 100%], then the market may be deemed to be overvalued
If Market Capitalisation < GDP [ meaning the ratio is below 100%], then the market may be deemed to be overvalued.
I have tried to analyse the data for the FY ended March 2018. As on that date, the ratio was 103% based on four-quarter training nominal GDP. However, the Central Statistical Organisation releases its data based on advance estimates of nominal GDP. Such method of calculating the ratio claims it to be 94%.
Whether you consider 103% or 94%, the indications are clear that the market is moving into overvalued zones and a correction can set in any time. (Remember that the market is always on a lookout for a ‘stupid’ reason to correct itself!)
Well, although I understand it is too simplistic of an assumption, still broadly one can assume that the GDP of a country and the stock market performance are positively co-related. Theoretically, if GDP of a nation expands, the market capitalisation too has to expand. Same applies to the decline of GDP as well. Moreover, if the markets are performing really well, its not a very wrong thing to assume that the Indian economy (GDP) is doing quite well. The market capitalisation to GDP ratio works on this very thought process.
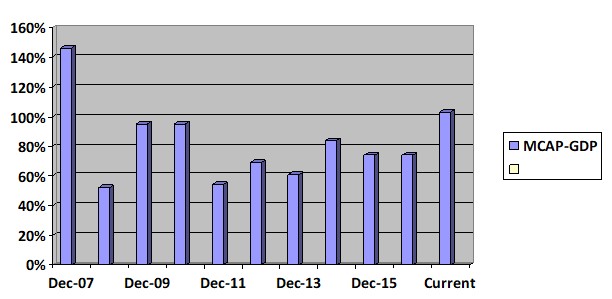
Let me present some historical data between December 2007 to the current times (March 2018), based on the listed companies on the Bombay Stock Exchange (BSE).
(Data source: Bloomberg)
The ratio was highest back then in 2007 (a whopping 146%). Although, one must bear in mind that the data is not perfectly comparable because the list of companies in the BSE keep on changing. The trend gives a hint that currently the markets are overpriced. The GDP has grown from a sluggish 5.7% in the first quarter of fiscal 2018 to 6.3% in the second quarter. Since the domestic and overseas capital is flowing in, the equity markets are trying to make new highs. The ratio I am talking about is perhaps set to touch 105% or 110% mark in the days to come. This however, is not a great point to make fresh buy in the equities. You may also conclude that the markets are somewhat ahead of its fundamentals!
Many people feel that market cap to GDP ratio is not of much use in the Indian context. The argument does hold ground sometimes because the market capitalisation considered is mostly of the listed companies whereas the GDP contributors are present both in the organised as well as the unorganised sectors. Also, in India, hardly 3% people are invested in the core capital markets, unlike in US the ratio of households invested in the markets is more than 50%. So it is quite right to say that even if the economy grows, not all of that growth will enter the stock markets! when the economy grows, all of the money might not enter the stock market.
I very well understand the limitations of ratios. However, some signs and symptoms are too tempting to be ignored. I am not saying that this ratio is all that you need but its definitely wise to keep it your kitty and use it wisely with other indicators.
CA Sarvesh Mopkar
(Sarvesh Mopkar is a member of the Institute of Chartered Accountants of India. He has been a professor of finance and has been a freelance trainer with various reputed Business colleges. He is passionate about financial planning and equity research and has been training in that domain for over 8 years.)


